


Scale: Regional
Study area: Belt and Road region
The most notable features of urbanization include urban expansion and demographic change. A large amount of land resources are lost due to rapid urbanization. These lost resources have great societal, economic, and environmental value. Additionally, the physical growth of urban areas is often disproportionate in relation to population growth, resulting in low land use efficiency. Therefore, it is important to understand and coordinate human-land relationships by acquiring information on both urban land consumption and population growth. This is necessary to effectively monitor and assess the urbanization process. The SDG 11.3.1 indicator is defined as the ratio of land consumption rate (LCR) to population growth rate (PGR) and is used to describe the relationship between urban expansion and demographics.
This indicator involves a focus on the following factors. (1) Global high-resolution urban land mapping is used to precisely delineate the urban footprint, which provides data support for monitoring and evaluating SDG 11.3.1. (2) There is a focus on quantitatively assessing the relationship between LCR and PGR for 340 prefecture-level cities in China. Furthermore, the sustainable development of Chinese cities is assessed on a national scale. (3) An additional focus lies in monitoring and measuring the SDG 11.3.1 indicator for 1,500 cities with populations greater than 300,000 from 1990 to 2015 at 5-year intervals in the Belt and Road region. This research is significant for providing spatial data and decision support for SDG 11 urban sustainable development.
| Target 11.3: By 2030, enhance inclusive and sustainable urbanization and capacity for participatory, integrated, and sustainable human settlement planning and management in all countries. |
| Indicator 11.3.1: Ratio of land consumption rate to population growth rate. |
The ratio between urban LCR and PGR is based on the SDG indicator framework and is calculated as the following.
(1) LCR is calculated as:
LCR=LN (Urbt+n ⁄ Urbt ) ⁄ (y)
where Urbt is the total extent of the urban agglomeration in km2 for the past/initial year, Urbt+n refers to the total extent of urban agglomeration in km2 for the current year, and y expresses the number of years between the two measurement periods.
In urban remote sensing, scientists have discovered that urban impervious surfaces extracted from remote sensing images can accurately reflect urban surface information and land use intensity. In this case, the urban impervious surface is extracted from multi-temporal Landsat TM/ETM+ imagery acquired from 1990 to 2010. In this study, an effective urban land extraction method was proposed for the 2015 product using ascending/descending orbits of Sentinel-1A synthetic aperture radar (SAR) data and Sentinel-2 multispectral instrument optical data acquired from January 1, 2015, to June 30, 2016. The method includes an assessment of textural and phenological features.
(2) PGR is calculated as:
PGR=LN (Popt+n ⁄ Popt ) ⁄ (y)
where Popt is the total population within the city in the past/initial year, Popt+n refers to the total population within the city in the current/final year, and y expresses the number of years between the two measurement periods.
In China, the population spatialization method is used to obtain the spatial distribution for population. Firstly, nine independent variables related to population are constructed using land use data and Defense Meteorological Satellite Program (DMSP) and Operational Linescan System (OLS) nighttime light data. Secondly, geographically weighted regression is used to construct a population spatialization model. Lastly, a gridded population distribution is acquired with a spatial resolution of 1×1 km. In the Belt and Road region, the method uses population data for 1,860 cities (with populations greater than 300,000) released by the UN.
(3) The ratio of LCR to PGR (LCRPGR) is estimated as follows:
LCRPGR =(Land consumption rate/ Annual population growth rate)=(LCR/PGR)
- Ascending/descending orbits of Sentinel-1A SAR data (150,000 scenes) and Sentinel-2A optical data (340,000 scenes). Data is acquired for the dates ranging from January 1, 2015, to June 30, 2016. The data also includes Landsat imagery acquired from 1990 to 2010, and DMSP/OLS nighttime light data acquired in 1992, 2000, and 2010. Lastly, data relating to the Shuttle Radar Topography Mission (SRTM) and the Advanced Spaceborne Thermal Emission and Reflection Radiometer (ASTER) Digital Elevation Model (DEM) are also included.
- Land use/land cover data with 30-meter spatial resolution acquired in 1990, 2000, and 2010.
- The fourth, fifth, and sixth China Census data (county level) as well as UN city population data.
(1) High-resolution global urban impervious surface mapping
Figure 1 displays the global 10-meter resolution urban impervious surface distribution. The product results were compared with other urban land products, such as the Global Human Settlement Layer (GHSL), global land cover datasets at a 30-meter resolution (GlobeLand30), National Land Cover Database (NLCD), and CORINE Land Cover (CLC). In comparison with other methods, the product featured in this case was generated through fusion of optical and SAR data. The results reveal that the product provided a high correlation coefficient (R2>0.80) and high accuracy with an overall accuracy (OA) greater than 86%, a user accuracy (UA) greater than 82%, and a product accuracy (PA) greater than 90% at the global scale.
The method presented in this case has numerous advantages. 1) The method effectively resolves some limitations and problems for extracting impervious surfaces from single data sources and further improves extraction accuracy. 2) The method employs Big Earth Data processing technology and is based on different sensors (e.g., SAR and optics) and imaging modes (e.g., ascending/descending orbits). The method also employs 150,000 Sentinel-1A (S1) and 340,000 Sentinel-2 (S2) images. 3) The method achieves rapid fully automated urban impervious surface extraction. 4) Lastly, the methodology is useful for identifying human settlements located in low latitude areas.
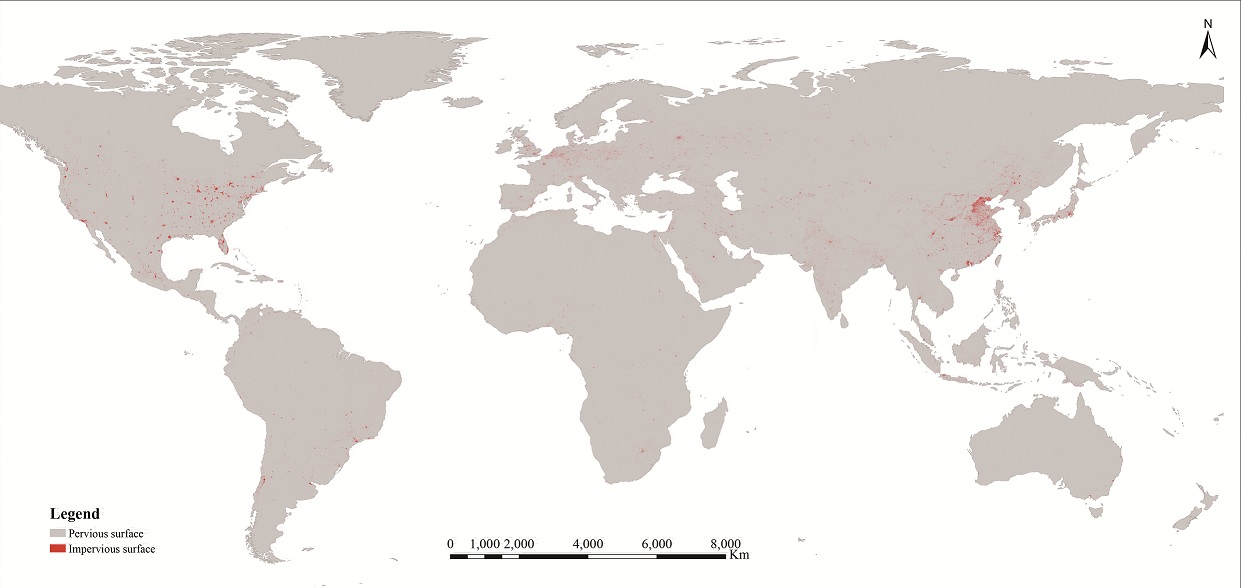 ⬆ Figure 1. Global 10-meter resolution urban impervious surface distribution (2015).
(2) Analysis of China’s urban expansion and population migration
LCR, PGR, and LCRPGR were calculated for 340 prefecturelevel cities in China during 1990-2000 and 2000-2010 to monitor the progress of DG 11.3.1 (Figure 2). Results from monitoring the SDG 11.3.1 indicator in China reveal that the ratio between LCR to PGR increased from 1.41 in 1990-2000 to 1.94 in 2000-2010. Therefore, compared with 1990-2000, the growth rate of built-up areas in 2000-2010 was faster than the rate of population growth. Additionally, it also found cities with higher LCRPGR (LCRPGR>3), including 19 cities in 1990-2000, and 47 in 2000-2010. These results suggest that the expansion of urban space in these cities needs to be effectively controlled.
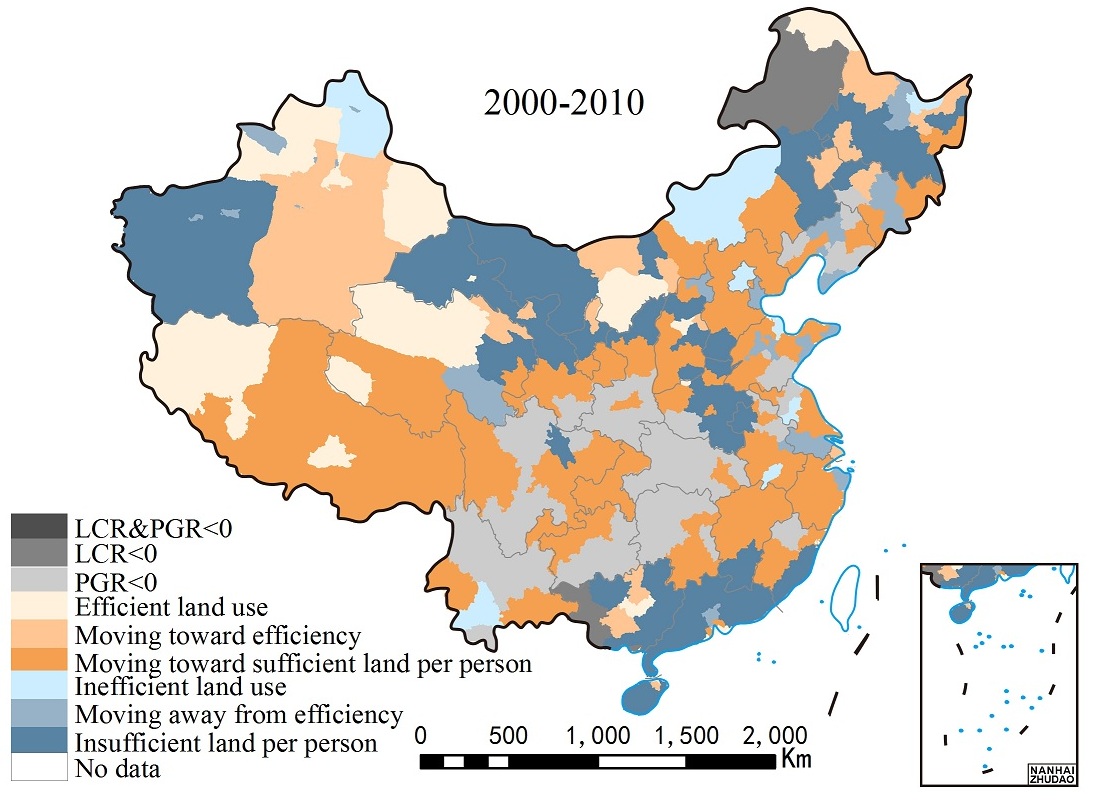
⬆ Figure 2. Spatial distribution of SDG 11.3.1 at 342 prefecture-level cities in China during 1990-2000 and 2000-2010.
(3) Analysis of urban expansion and population migration in the Belt and Road region
In this study, a national sample of cities was used to measure, monitor, and assess SDG 11.3.1 indicators at regional scales. A total of 1,500 cities with populations greater than 300,000 inhabitants in the Belt and Road region were selected for study. The UN’s demographic and census data for China was used to calculate the PGR value for each city for the period ranging from 1990 to 2015 at 5-year intervals. Figure 3 displays the LCRPGR results for the national SDG 11.3.1 indicator in the Belt and Road region.
Results reveal that the population of most countries in the European region experienced negative population growth during the period from 1990-2005, resulting in LCRPGR < 0. After 2005, population growth in the European countries was observed to stagnate, resulting in larger LCRPGR values. The population of African countries grew rapidly during the 1995-2010 period. In this region, the urban LCR was much smaller than the urban PGR, resulting in LCRPGR values that were less than 1. The African cities continued to develop rapidly after 2010, resulting in balanced PGR and LCR values. In Asia, most cities in Southeastern and Southern Asia maintained a relatively stable urban PGR and LCR during the period from 1995-2015. The LCRPGR values in this region were relatively average. Some cities in Western and Central Asia experienced rapid urban population growth during 2000-2010, resulting in a small LCRPGR value. During the period of 1995-2000, East Asia experienced rapid population growth, resulting in urban PGR values that were greater than LCR values, and LCRPGR values less than 1. The urban PGR slowed during 2010-2015, and the urban LCR was much greater than the urban PGR during this period. The LCRPGR value was greater than 2, indicating that the urbanization of land was far greater than the urbanization of population.
In summary, the results from monitoring the SDG 11.3.1 indicator in developing countries in the Belt and Road region reveal that the ratio between LCR to PGR increased from 1.24 in 1990-1995 to 2.67 in 2010-2015. This result provides an indication of the major challenges that lie ahead for urban sustainable development in these countries. A negative value for this indicator may be valuable for countries and regions with negative or stagnating population growth. This result may suggest that the indicator does not accurately reflect the relationship between land and population urbanization in these countries and regions.
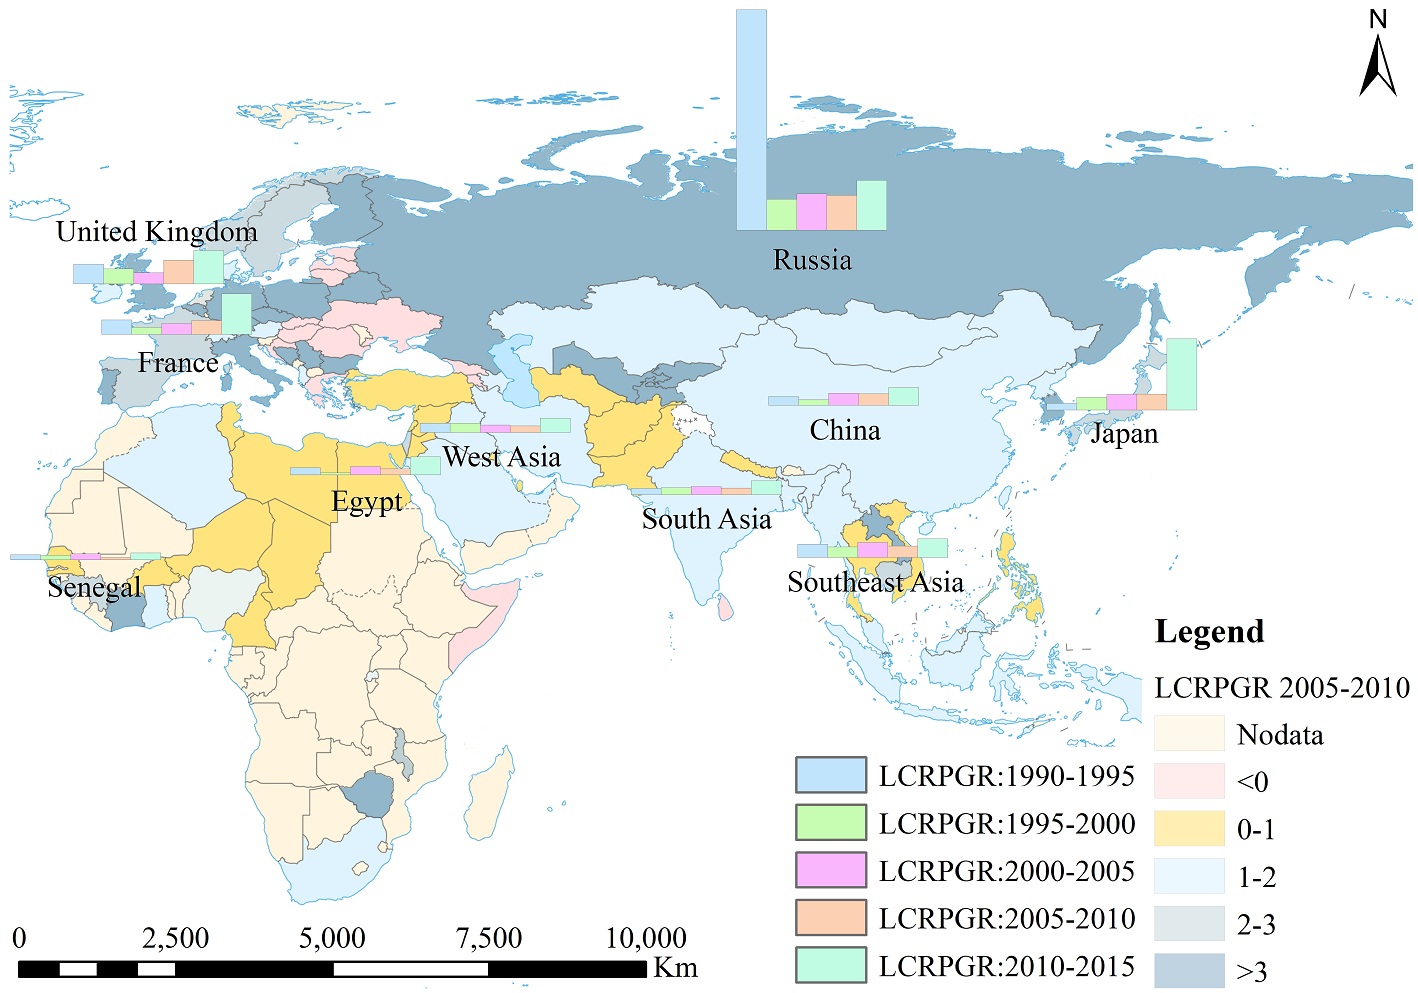 ⬆ Figure 3. LCRPGR results for the national SDG 11.3.1 indicator in the Belt and Road region.
| Highlights |
|
Future work will focus on measuring and monitoring the SDG 11.3.1 indicator and “LCRPGR” values for 1,800 cities with populations greater than 300,000 at the global scale.
SDG 11 is directly related to at least 11 other SDGs. About onethird of all SDG indicators can be measured at the city level, making cities an important unit for measuring, monitoring, and tracking SDG progress. Future work will include cross-over and comprehensive assessment studies between SDG 11 and other SDGs.
Global urban impervious surface products can aid developing countries that do not have the technical and financial resources to monitor their urban development. These products will enable developing countries to describe the relationship between land use and PGR in urban environments. The high-resolution global urban impervious layer data will be updated every three years.
Future work also aims to resolve several existing issues. (1) One issue is the scale effect problem, which refers to the different resolutions between the urban products acquired in 1990-2010 and 2015. This effect results in the overestimation of indicator SDG 11.3.1 during the 2010-2015 period. (2) Another issue relates to the spatial coupling between the urban extent and population data, which results in uncertainty for measuring indicator SDG 11.3.1.