


Scale: Regional
Study area: Belt and Road Region
Glaciers are very sensitive to climate change and are a natural indicator of climate change. During the past 100 years, in response to increasing global and regional temperatures, glaciers around the world have been characterized by retreat and thinning. The countries and regions along the Belt and Road has numerous glaciers with a glacial area of 100,000 km2. The Tianshan Glaciers provide fresh water for 10 rivers, including two Pan-Central Asian transboundary rivers, such as the Ili and Aksu, which are essential for the survival of nearly 70 million people in the region, their economic and social development, and also for the preservation of ecological systems along these rivers. Arctic sea ice is another important part of the climate system. Changing sea ice has a significant impact on the region and even more pronounced impact at the global scale by affecting weather and climate through complex feedback processes. Thus, any change in sea ice is an important indicator of global climate change. Since 1979 when satellite data became available, sea ice in the Arctic has been melting at increasing rates, with completely ice-free areas appearing in the Arctic during summer season. Therefore, monitoring and forecasting changes in glaciers and sea ice in time and space has important scientific and applied value.
| Target 13.3: Strengthening education and advocacy on climate change mitigation, adaptation, impact reduction and early warning, and strengthening the capacity of personnel and institutions in this regard. |
The historical glacier inventory before the availability of satellite images is mainly based on topographic maps, and the glacier boundaries were manually digitized by correcting aerial photographs. For years after the availability of satellite images, Landsat images were used to extract glacier extension by the band ratio method (TM3/TM5) combining the morphological opening and closing operation method, and then referring to topographic maps, ASTER images, Google Earth, and the first glacial inventory data to revise glacier vector boundaries and to ensure that glacier boundaries, especially debris covered glaciers, were accurately identified. DEM data was then used to create watershed boundaries and ridgelines were extracted, and an individual glacier was identified. For sea ice prediction, the intra-seasonal and seasonal climate prediction system of FGOALS-f2.1 is adopted. The system was developed by the State Key Laboratory of Numerical Modeling for Atmospheric Sciences and Geophysical Fluid Dynamics (LASG), CAS Institute of Atmospheric Physics (IAP). This system includes the atmospheric-ocean-land-sea ice four-component model and a coupler; the atmospheric component uses the atmospheric circulation model FAMIL2.1, which was independently developed by IAP-LASG. The model uses a dynamic core with a finite volume cubic spherical grid with a horizontal resolution of approximately 1 degree, a vertical resolution of 32 layers, and a top of 2.16 hPa (approximately 45 km). The prediction system uses the nudging method to assimilate the reanalysis data of the atmosphere and oceans in real time. The assimilation data are the United States Global Forecast System (GFS) reanalysis data and the Optimum Interpolation Sea Surface Temperature (OISST) real-time ocean data, and the time resolution and assimilation time window are 6 hours. The atmospheric analysis field includes standard isobaric surface wind field, temperature field, and height field data, and the ocean field includes sea surface analysis data.
- 1:100,000 & 1:50,000 topographic maps.
- Landsat Multispectral Scanner (MSS) / TM / Enhanced Thematic Mapper (ETM) / OLI data.
- RGI 6.0 (Randolph Glacier Inventory 6.0), the first Chinese Glacial Inventory data and the second Chinese Glacial Inventory data.
- GFS real-time reanalysis data, OISST real-time ocean data.
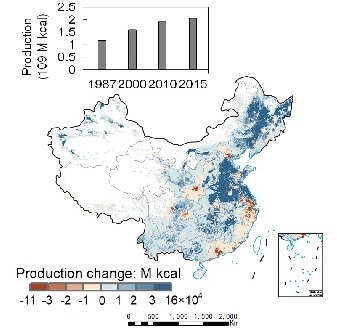
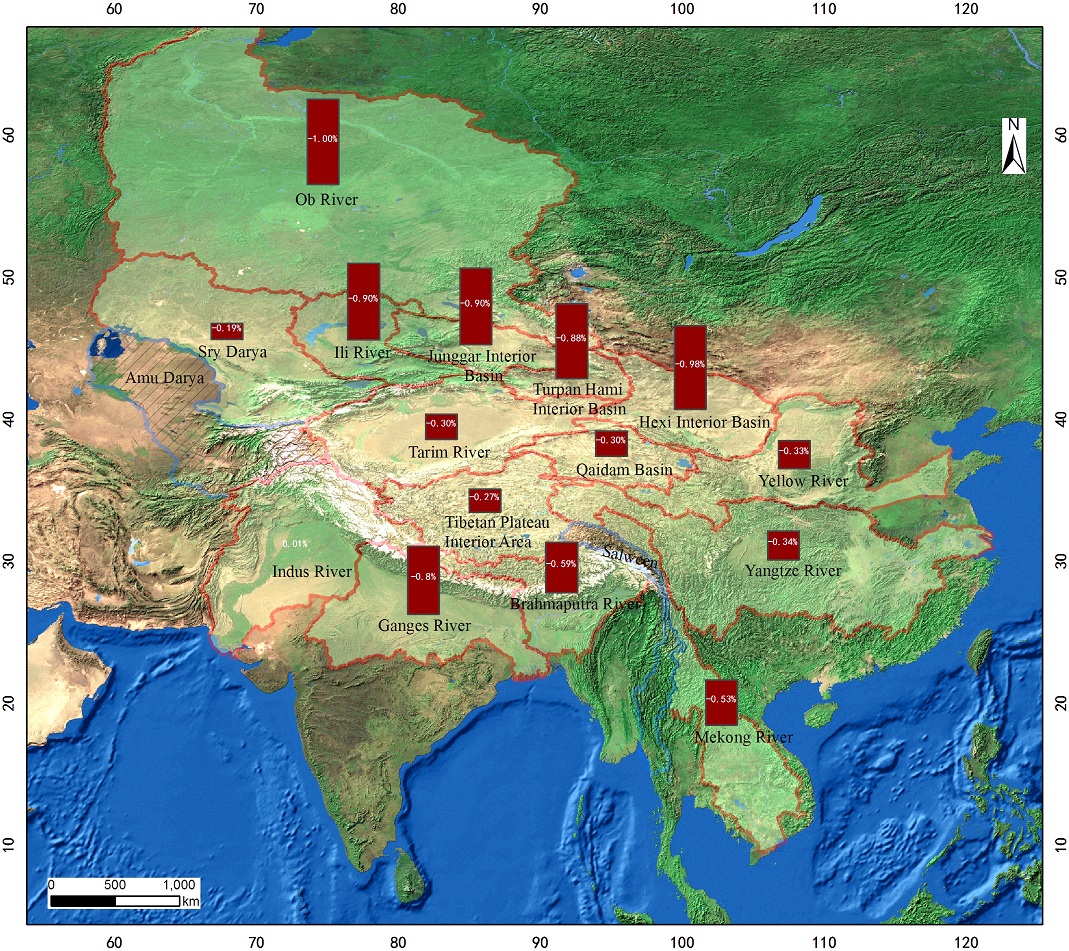 ⬆ Figure 1. Annual glacier area changes in 15 basins in the countries and regions along the Belt and Road.
The changes in glaciers in 15 basins along the Belt and Road (not including the Amu Darya River and Salween River) have been monitored since 1969, and the overall glacier area has been reduced by 9,300 km2, accounting for 17.2%. The glacier area in the inland basin of the Ili River and Hexi Corridor has decreased rapidly with an annual change rate over 0.8% a-1 under the influence of the northern branch of the westerly belt, followed by the Ganges, the Yarlung Zangbo River, and the Mekong River under the influence of the Indian monsoon. The annual change rate of glaciers in the Tarim River and Qinghai-Tibetan Plateau has decreased slowly. However, the glacier area of the Indus River Basin, which intersects the southern branch of the westerly belt with the Indian monsoon, has little change or even an increasing trend (Figure 1). More detailed data shows that according to the completed survey data of the Tianshan and Qilian Mountains in China, the total glacier areas in the Tianshan in China and Qilian Mountains around 1969 were 8,487 km2 and 1,986 km2, respectively. China’s Tianshan glaciers shrank by 16.5% between 1969 and 2013. Glaciers shrank by 9% between 1969 and 2000 and slowed to about 7% between 2000 and 2013. It also found differences between the size and distribution of glaciers due to climate change. That is, the shrinkage rate of glaciers in large glacier basins, such as the Aksu River and Weigan River (larger than 1.0% a-1), is different from that in smaller watersheds, such as the Baiyang River and Kaidu River (less than 0.5% a-1), which reflects that small glaciers are more sensitive to climate change. Glaciers in Qilian Mountain were reduced by 683.674 km2 between 1970 and 2018. The glaciers retreated by 34%, or 0.7% a-1.
Based on the sea ice prediction data reported by the FGOALS-f2 seasonal forecasting system on June 1, 2019, the Arctic sea ice extent was 9.28 million square kilometers on June 30. The sea ice extent distribution is shown in Figure 5-6 (right). Compared with the National Snow and Ice Center (NSIDC) data, the FGOALS-f2 prediction results are highly similar and can provide reference information for Arctic channel development
and other related strategic planning. The methodology presented in this case and the production of sea ice forecast data can provide spatial data and decision support for the 2030 Agenda for Sustainable Development.
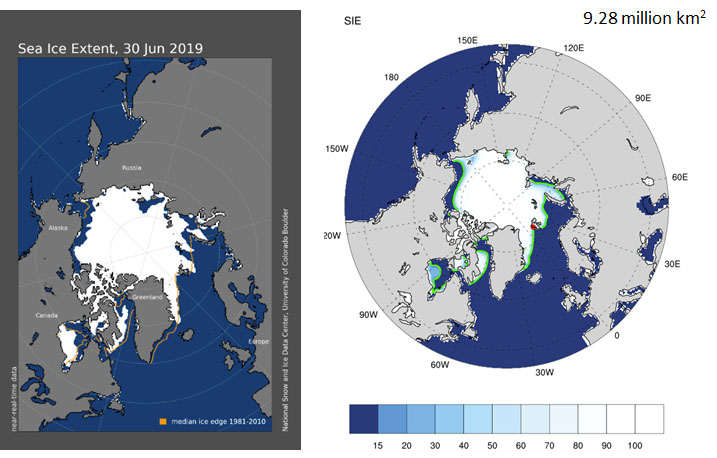
⬆ Figure 2. Arctic sea ice extent observed by NSIDC on June 30, 2019 (left), Arctic sea ice extent predicted by the FGOALS-f2 prediction system on June 30, 2019 (right)
| Highlights |
|
Understanding the impact of glacial changes on water resources is important for glacial water resource management, and can provide insight into regional infrastructure development and capacity building. Over-utilized rivers should be specifically focused on for preservation of water resources and ecological environments.
In the future, the study will release and update Arctic sea ice prediction products at daily intervals. Research will be carried out to understand Arctic sea ice ablation and its physical mechanism for climate feedback and the evolutionary trend of sea ice in the future, and Arctic sea-ice-air interactions and their influence on weather and climate.