The freezing/thawing index is widely used in permafrost mapping and climate change assessment; it is an important basic dataset. However, most previous studies on freezing/thawing index are based on monthly averages.
The freezing/thawing index over the circum-Arctic for the period 1901-2015 was computed, which clearly reflected the cold and warm degree in different land areas. With increasing latitude, the freezing index increased from south to north except for the Tibetan Plateau.The maximum freezing index was about 10,000 °C-days in north central Greenland. The thawing index decreased from south to north; near 25°N latitude, the freezing index was less than 500°C-days but the thawing index was much higher and it even reached 10,062°C-days. However, the thawing index was almost 0 °C-days in northern Greenland where the freezing index was highest.
Based on this freezing/thawing index, the permafrost extent over the circum-Arctic was also simulated. The simulated permafrost extent area during 2000-2015 was 19.96×10⁶ km2. The results were published in online journal science of the total environment on January 14,2019.
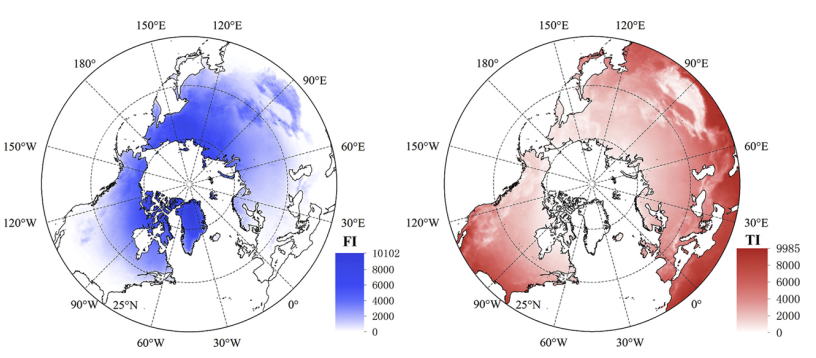
The spatial distribution of the freezing index (FI) and thawing index (TI) over the circum-Arctic, based on CRUNCEP datasets
Reference:Shi, Y., Niu, F., Lin, Z., & Luo, J. Freezing/thawing index variations over the circum-Arctic from 1901 to 2015 and the permafrost extent. Science of The Total Environment. 2019,660:1294-1305.
https://www.sciencedirect.com/science/article/pii/S004896971930138X